ELWAVE 9.1 builds on the features introduced in version 9.0 and enhances the experience for real-time traders significantly by offering super smooth screen updates, persistent storage of historical data and by making custom indicators more suitable for use in trading systems.
More information on the new features can be found below.
- New customers please order
your copy of ELWAVE here.
- If you have a service contract, you should
have received new license info for version 9.1 by
email. If you have not received your license info
yet, please
let us know.
- If you purchased or upgraded to ELWAVE 9.0
after November 1, 2008 you are entitled to a free
upgrade to version 9.1 If you have not yet received
your license info, please
let us know.
- If you are an existing users of ELWAVE
but do not have a service contract, you can order
your upgrade here. Be sure to enter your serial
number (and license key if you have a dongle) using
the link provided on that page.
This release of ELWAVE 9.1 contains the following new features and enhancements:
- Support for MetaTrader 4 (requires UDS ServerFeed)
It is now possible to import data from MetaTrader 4 directly into ELWAVE. The chart will also be updated in real-time.
This feature requires that you attach a single .ex4 Script to one of your charts in MetaTrader. In addition, MT4 script DLL calls and DDE server must be enabled in MetaTrader.
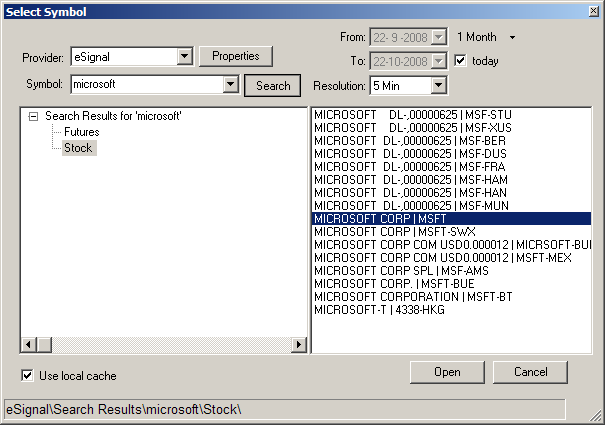
- Symbol search capability for eSignal
The Search button in the Select Symbol window is now functional for eSignal. Simply enter your search query in the Symbol field and click on Search.
- Persistent local storage of historical data
Historical data obtained from UDS based real-time data feeds is now stored locally on your hard drive. This means that the amount of available history for a given symbol will increase as time goes by. This currently applies to eSignal, Quote.com, FiBBS, Yahoo!, MSN, IQFeed, Tai-Pan Realtime and TAL RealTick.
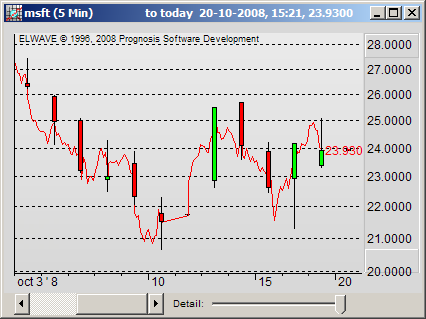
- Super smooth display updates in real-time charts
Very frequently updating real-time charts are now easier on the eyes with all flickering suppressed using a technique called ‘double buffering’, resulting in super smooth screen updates.
- Independent time units for custom indicators
Thus far indicators in ELWAVE have been calculated based on the bars as shown in the price chart. By default, these bars are re-compressed (‘Automatic’ compression setting) to fit the desired date range into the chart window. This is ideal for working with Elliott Wave patterns, as it allows you to zoom into exactly that pattern you are interested in. It does also mean however that the bars that form the basis for the indicator calculation depend on the zoom level. For example when you are zoomed out completely, each OHLC bar may represent (on average) say 5 underlying daily records but when zoomed in maximally each OHLC bar will represent exactly one records. In both cases the value for a 14 period RSI will be different since in the first case it will actually be more like a 14-week RSI (5 trading days representing one week) whereas in the maximum zoomin situation it will be an actual 14 day RSI.
This has the (for some uses) advantage of the calculation of the indicators scaling with your zoom level. However, now that we have custom indicators, the desire to use those in combination with the Elliott Wave analysis to build a trading system results in a desire for guaranteed consistency in indicator calculation. For this reason we have added a new property called Time Unit to the indicator Properties dialog as can be seen in the following screenshot:
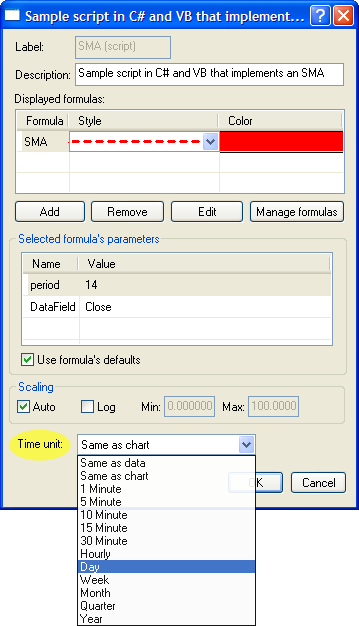 
With the Time unit field you can now select whether the calculation (and display) of the indicator is based on the bars currently shown in the pricechart (Same as chart, the method used in previous versions of ELWAVE), or on the underlying loaded data (Same as data) or should be based on a specific compression unit that can be selected indepdently for each indicator in a chart or pane. Note that multiple formulas in a single custom indicator all share a single setting for Time unit.
So now if you want to use a 14-day RSI as part of a trading setup, simply set the time unit to Day and the period to 14. The calculation of the RSI will stay the same irrespective of zoom level and even what data you have loaded. Of course you can’t select a time unit with a finer resolution than the data that has been loaded, so for instance if you load daily data, all intraday resolutions for Time unit are invalid.
Note that you can select a Time unit for your indicators that is either higher or lower in resolution that what you have selected for the on-the-fly chart compression, as long as the data that has been loaded supports that resolution. So for example if you load 5-minute data, you could display your chart as daily bars and at the same time display an indicator based on 5-minute bars. You can even do this in the price chart itself:
- Added minimize and restore buttons for maximized charts
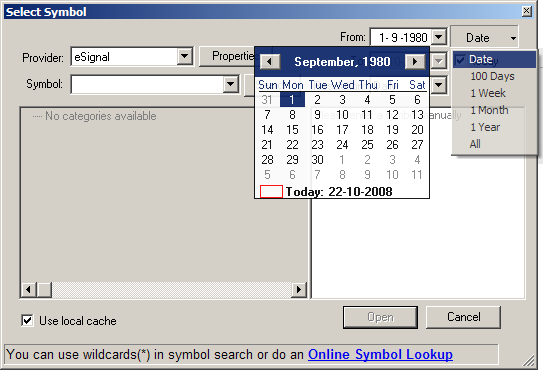
- Select Symbol date picker
Select Symbol (Chart|New chart…) window now offers additional methods to determine the start of the date range to load. Instead of specifying the date itself you can now select 100 days, 1 week, 1 month, 1 year, or ‘all’. Selecting a date directly is still possible and can now be done through a dedicated ‘Date picker’ control
- Scan Inspector window is now resizable
- On-the-fly compression control
The active chart window’s on-the-fly compression can now be seen and changed in the status bar. Formerly this required right-clicking on the chart and selecting Compression|… .
- Automatic software update notification
ELWAVE will now automatically check for software updates on startup and notify the user if a new version is available
- Improved chart name generation for saved charts
Generated chart names no longer include the symbol twice if the symbol and name field from the original data source are the same
- Added multi-select capability to Chart|Open…
- Direct folder navigation in Chart|New chart...
The ‘New chart from price data’ window (Chart|New Chart…) for file-based data formats now allows pasting of a path/folder into the File name field. Typing a symbol or name in this field will search and select the first matching symbol from the pane with the symbol list
- Improved Target Cluster appearance
Target Clusters now look better if a background color with a gradient is chosen for the chart
- Automatic Target Cluster update enabled by default
- Summary Inspector
The Summary Inspector is now shown automatically on startup (unless disabled through View|Summary Inspector) to help new users
- Correct bad ticks
The function Price data|Correct bad ticks is now also functional on OHLC historical daily or intraday data to
remove spikes.
Important note: Automatic spike removal can never be perfect. There is always a chance that some spikes will be missed and not corrected. Vice versa, there is a chance that some actual realized prices will incorrectly be recognized as spikes and filtered out. In either case this will have an effect on your analysis results. Use this function with care. The number of changes that were made are displayed in the status bar during operation and in the confirmation box at the end. If in doubt, for example if the number of corrections reported appears to be more than the number of spikes you have visually identified, check the ELWAVE.LOG file (accessible through RLogApp) to check which changes were made.
- Correct bad ticks automatically on import
By enabling this option (found under the Price data menu) all data is subjected to the Correct bad ticks function automatically during import. The number of changes that were made are displayed in the status bar during operation but not confirmation box will be shown after the function finished. Use this function with extreme care (read the Important note in the section entitled 'Correct bad ticks')
|
|